2023 Winter Market Update
Winter Market Update
Cutting out the hype

Welcome to PMC’s Winter Insights.
Property market and interest rate predictions continue to make the headlines… big Bullish or Bearish statements by various experts are used to play on everyone’s emotions.
Below our team provide you with the facts and what we are witnessing on the ground in the markets that we specialise in.
BRISBANE
Note; our commentary is specifically focused on the residential market within 15km radius of the Brisbane CBD.
GENERAL INSIGHTS
- CoreLogic has reported that Brisbane has seen 5 consecutive months of positive capital growth in 2023 and an uplift in values of 1.3% in June alone.
- This now places Brisbane values at only 8.2% below the peak of the market in May 2022, however despite this drop, Brisbane values are 30.1% higher than pre-Covid levels.
- According to CoreLogic, the number of properties advertised for sale is 42% lower than the average of the past 5 years which indicates a substantial shortage of available properties to purchase.
- Rental values have increased substantially this year: Housing 8.8%, units 16.3%.
- The National Housing body indicates that housing and unit construction approvals are at a decade low which indicates continued under-supply for the short-term future which will likely continue to put pressure on housing values.
ON-THE-GROUND INSIGHTS
- Despite what the statistics say for Brisbane, housing in the inner ring appears to be transacting at values very close to what we witnessed at the peak of the boom.
- The vast majority of buyers are home buyers while most investors are still sitting on the sidelines. This appears to be a significantly higher % weighting to home buyers than what we have traditionally seen in the market.
- Agents have told us their appraisals numbers have been increasing however most seem to be investors looking to exit the market due to affordability.
- Stock is still tight which is resulting in high numbers at open homes and reduced days on market. Unless a lot more stock becomes available, we don’t expect to see any softening in values in the short term.
- Based on the conversations our team is having with over 200 + agents per week, very few agents are indicating that they have higher volumes of stock coming on in Spring despite this recent increase in appraisals.
- The most competitive price point for housing is $950,000 – $1,500,000 with most new listings seeing in excess of 15-20 groups at the first open home.
- Reduction in borrowing capacity appears to be a large reason this sector of the market is very competitive for entry level home buyers.
- The prestige market (properties over $2M + ) is still in high demand for completed and “move-in ready” homes. Properties that require improvement/renovation are still patchy.
- Brisbane’s house record was set in April 2023 with the sale of “Amity” in New Farm for $20,500,000.
- The apartment and townhouse market is very buoyant and in most cases we are experiencing multiple offer situations after the first open home.
- The middle to outer ring suburbs (10-15km from the CBD) appear to be experiencing a strong bounce-back in prices and approaching levels witnessed at the end of the boom.
- Most notably, when the RBA paused interest rates in April this year, PMC’s enquiry jumped by almost 60% month on month, indicating that there are a large number of people still wanting to get into the market but waiting for the right time to buy or more certainty around rates.
RENTAL INSIGHTS
- At the date of this update, Brisbane’s housing vacancy rate is 1.0% (SQM Research) which is well below 3% which is considered a “balanced” market. This indicates Brisbane is still significantly under-supplied with rental stock.
- Brisbane’s vacancy rate has now remained below 1% since February 2022 which is the longest period of low vacancy in Brisbane’s last 30 years.
- With the reduction of investors purchasing, and an increased number of investors selling, our team expects to see continued pressure on rental supply.
- It appears that the peak of rental increases has now been reached as the cost of living appears to be impacting what tenants are willing/able to pay.
- It has also been noted by our team that a large number of people who were looking to rent have informed us they are looking to now purchase instead.
- The winter months have resulted in a slight reduction in the number of tenants inspecting properties, however multiple applications are still being received on all rental properties PMC manages.
- Tenants are still quite selective and conservative and properties in excess of $850pw are taking approximately 2-3 weeks to rent whereas lower value properties are generally rented within the first 7-10 days (if priced correctly).
- Enquiry from people moving from interstate has remainder reasonably consistent throughout the winter months.
SYDNEY
Note; our commentary is specifically focused on the Northern Beaches and North Shore markets that we specialise in.
GENERAL INSIGHTS
- Depending on which data provider you rely on (Corelogic, Domain, Protrack etc) Sydney property prices are up 4.5 – 5.5% since their trough late last year (November 2022). However prices still remain 3.0 – 4.5% lower than the February 2022 peak.
- The growth in prices over the last 6 months has been led by the top end of the market with some very strong prestige sales across Sydney.
- In fact, the top end of the market is up 5.7% for the three months to June.
- The 4 major banks have recently updated their interest rate predictions, with all 4 predicting 0-2 further rate rises and then interest rate cuts starting in the first half of next year.
- The combined value of secured housing finance increased 4.8% in May to almost $25 billion. Both owner occupiers and investors are seeing an uplift in borrowing from a recent low in February, which coincides with the trough in national home values.
- It will be interesting to see how this plays out with the new head of the RBA navigating the inflation data over the coming months.
- The share of newly listed investor-owned residential listings has increased to 36.3 per cent across Sydney during May which is the highest level in 2 years. This illustrates early signs that some landlords are starting to feel the pinch of the recent 12 interest rate rises.
ON-THE-GROUND INSIGHTS
- The consistent theme in our two markets of the Northern Beaches and North Shore is a lack of quality stock available to the market putting continued upward pressure on prices for quality property.
- The $2.0 – $2.5M price bracket for the Northern Beaches has significant pent up demand from buyers. Discounted selling for entry level houses is well and truly behind us with some strong results well in excess of guides recently.
- Generally speaking demand for quality houses below $3.5M is still very strong.
- 77 Bower recently traded at auction for circa $25M which is the highest sale price on Bower to date and again highlights the strength of the local prestige market.
- Another factor supporting this view is the recent apartment sales at the Aurora development (Royal Far West). One of the apartments sold for $16M and has a reported 212sqm on title. The sale represents $75,000 per square metre – a record for Manly
- We are again… hearing talk of increased appraisal numbers so we are hopeful this will flow through to an increase in listings/stock in Spring, but this is not a guarantee.
- The talk of the upcoming mortgage cliff in the last quarter of this year still gets quite a lot of energy, however we are still yet to see any signs of distressed selling in our marketplace and we believe these pockets of Sydney are better placed to handle the affordability challenges than other areas of Sydney.
- There is no doubt that household budgets have been facing a tougher period with interest rate rises and inflationary pressures and if we see an increase in listings in the tradition spring selling season, this will likely take some of the recent heat out of the market.
RENTAL INSIGHTS
- The Northern Beaches and North Shore rental markets have softened over the past couple of weeks. There has been a noticeable reduction in some asking rents, particularly for houses.
- Our Newcastle team has experienced a similar shift in the market where it appears the heat and urgency has come out of the rental market.
- Only time will tell if this is the “winter effect” with a lot of prospective tenants away for School holidays or vacations to Europe and Fiji… but we suspect this is a change in the market to a more balanced rental market.
- Landlords will need to be more measured when listing properties for lease. The days of bumping up rents by 5-10% seem to be behind us, for now.
- The graph below highlights the steep increases in rents we have witnessed nationally since late 2020 and inline with what we have recently witnessed, there are early indications that the peak in annual rental growth is behind us.
Sydney Rental Insights Graph
PROPERTY CLOCKS
In conjunction with our research partners, we analyse our Capital Cities and Major Regional Markets to assess where each market is currently sitting in their property cycle. Our property clocks are prepared for our clients and business partners to assist them with making informed property decisions. To request a copy of our most up to date property clock, please click the link below.
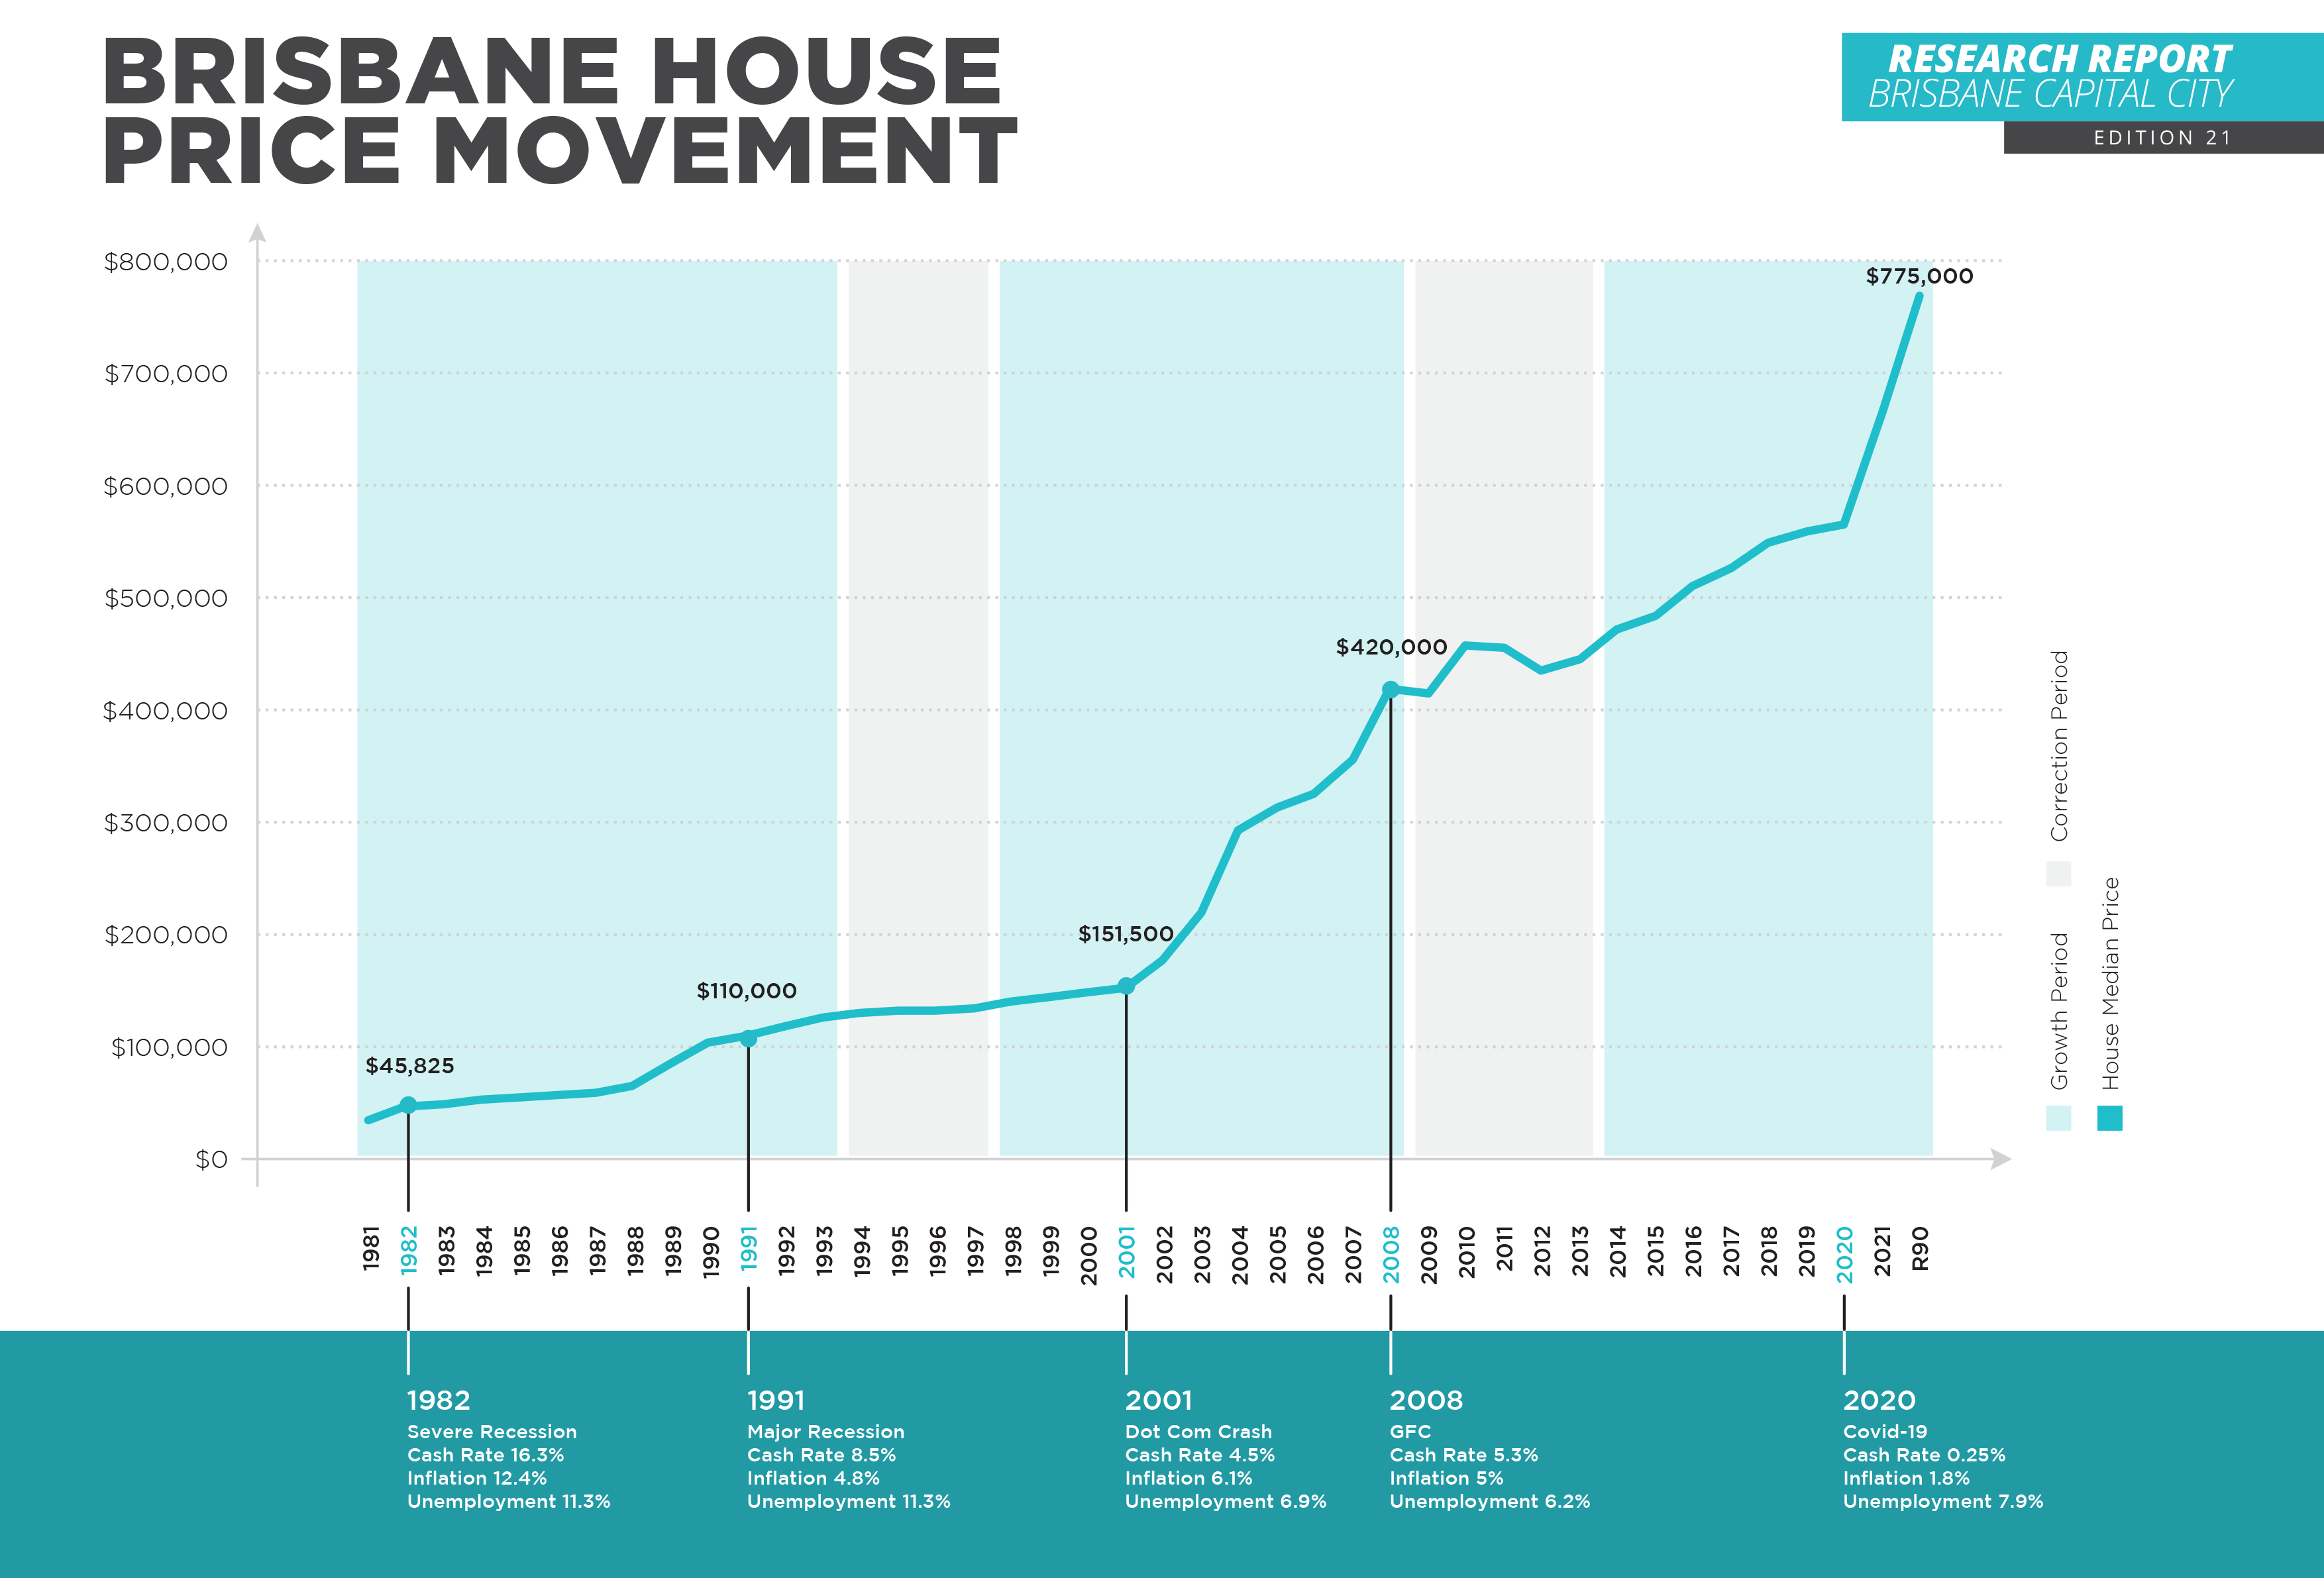
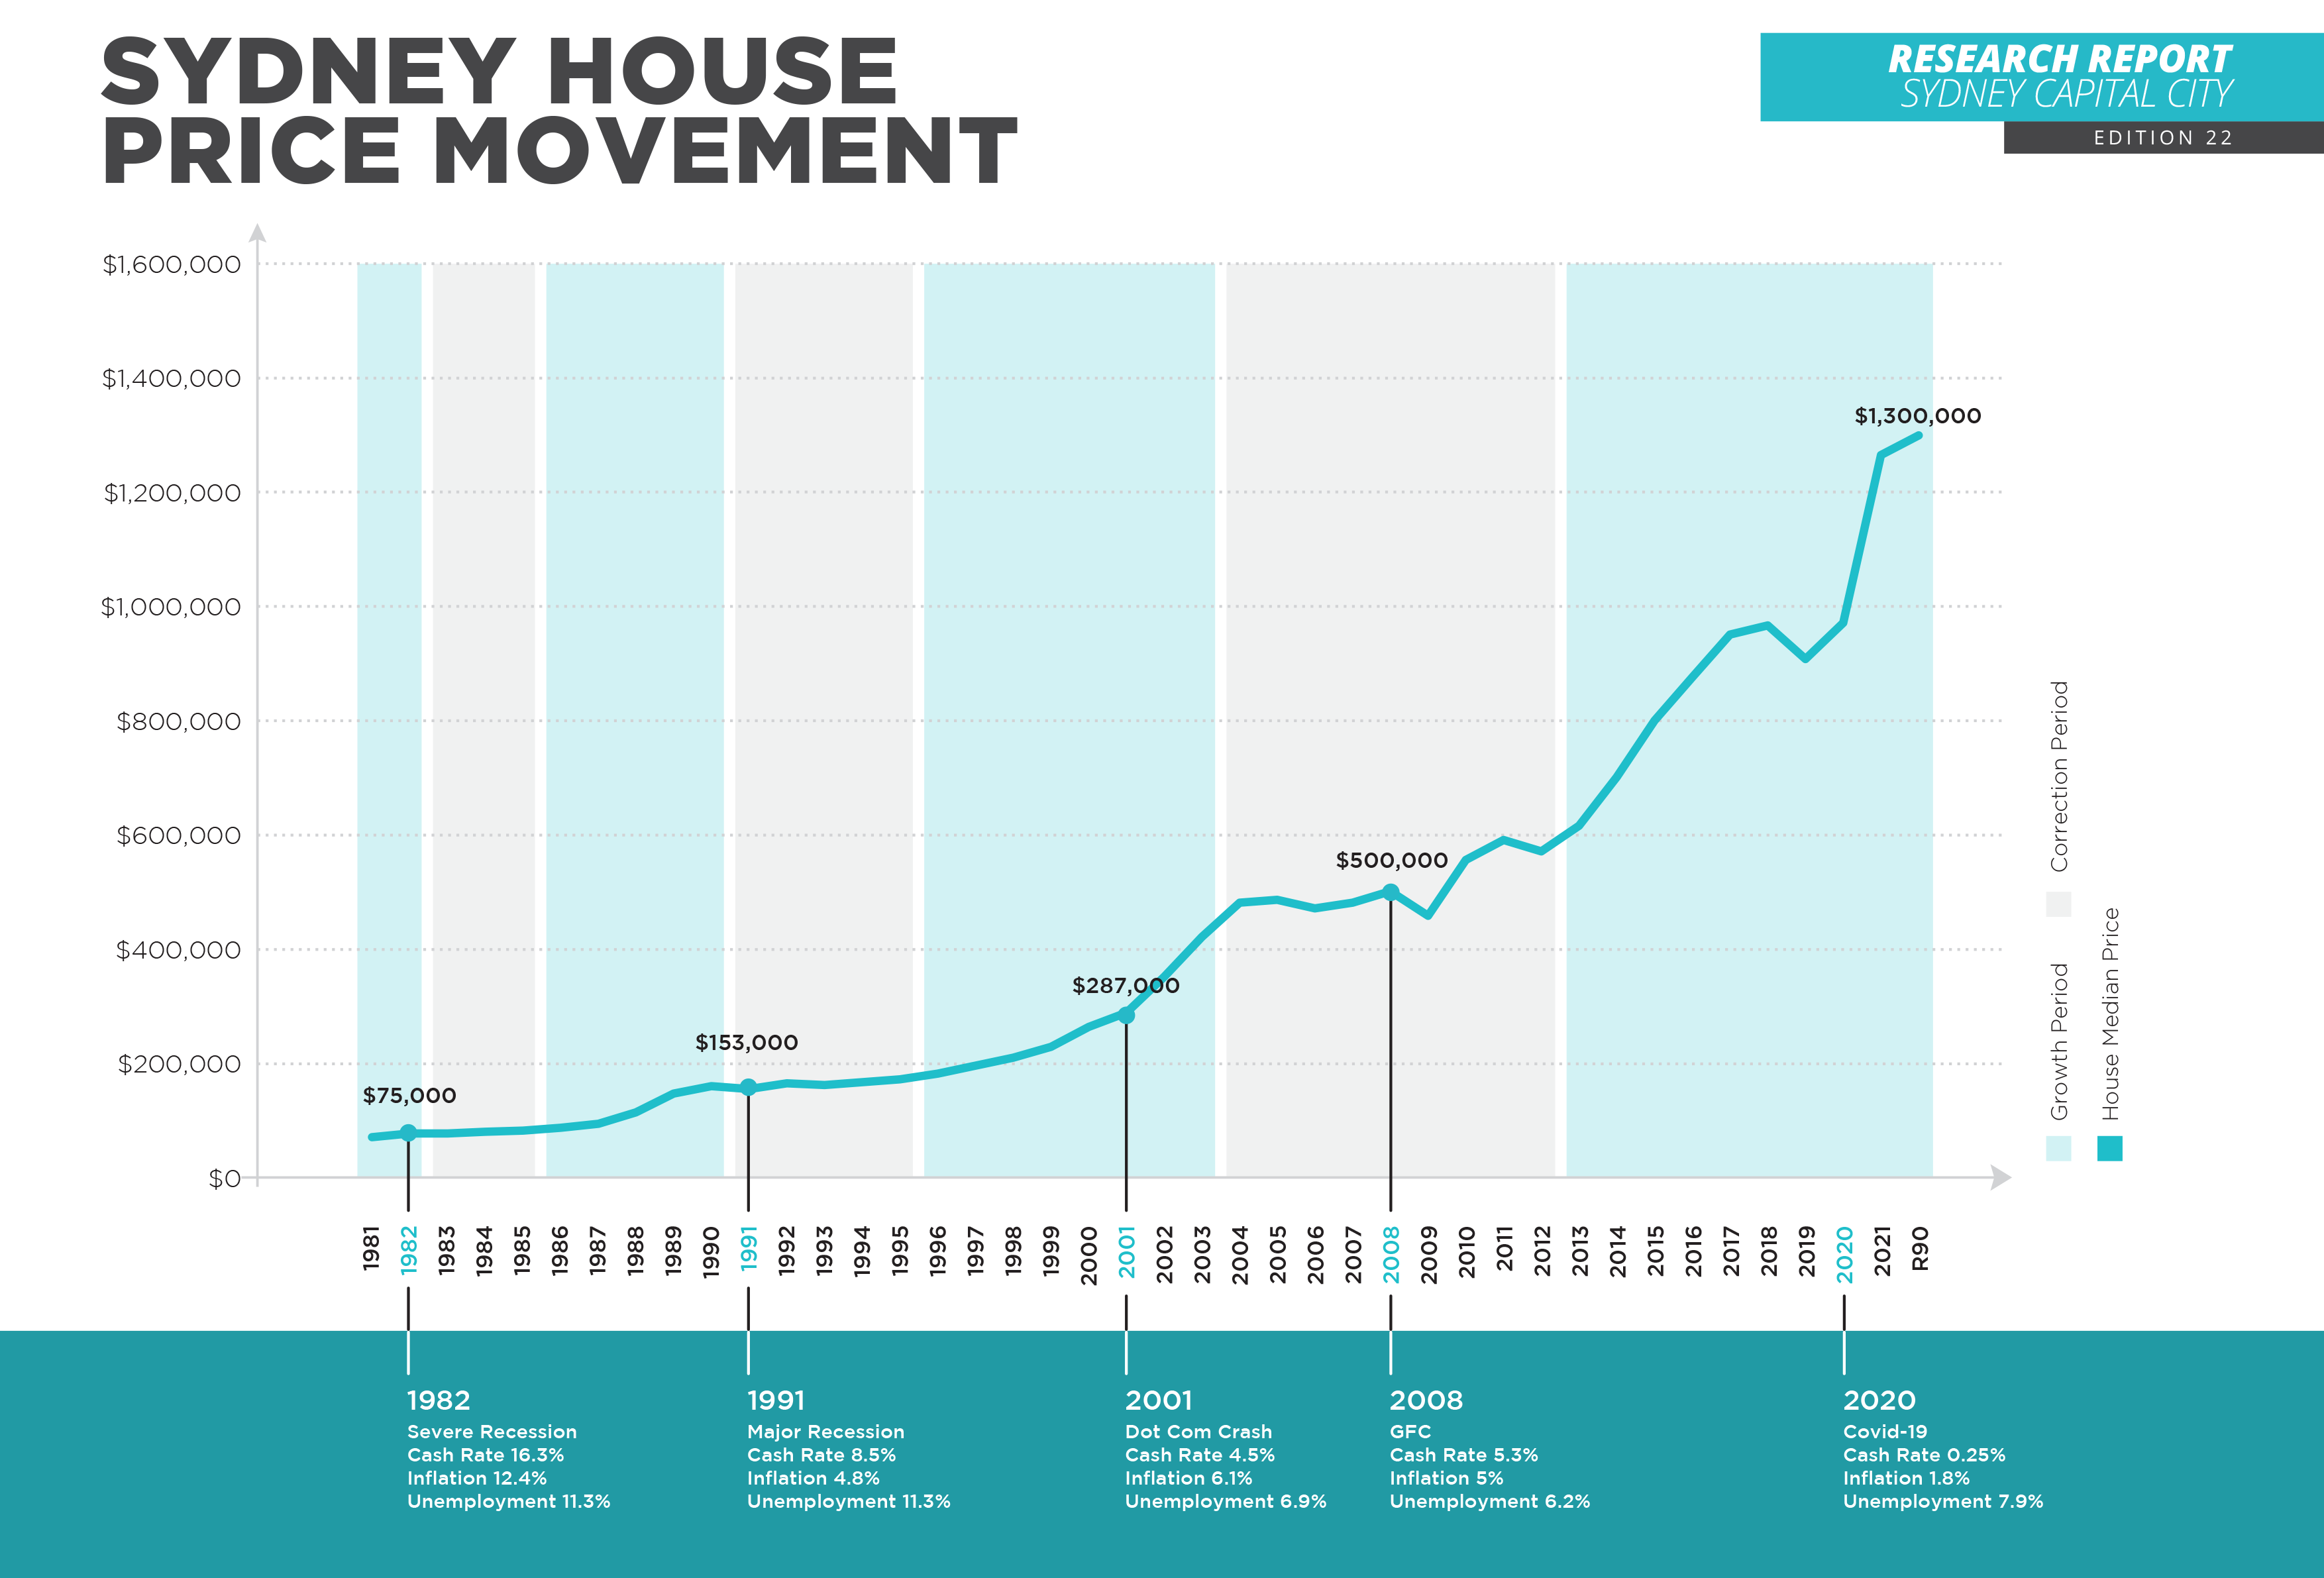
LONG TERM MARKET PERFORMANCE
If you own property in Brisbane or Sydney, the reports below are a great visual represetation of the property markets performance over the past 50 years.
KEEP UPDATED
If you are on social media, please click the Instagram or Facebook logo’s below to follow our latest purchases and regular on the ground market updates.
If you are considering buying a new home, an investment property or you require assistance with managing your investment properties, please reach out to our team and we would be happy to discuss your requirements.
We hope you enjoyed our second market update and we will be in touch again in Spring with our next quarterly insights.
BRISBANE
SYDNEY
Let us empower you to buy with confidence and buy well.
Let our professional team of Buyer’s Agents go on the journey with you.


